
RSCH FPX 7864 Assessment 2 Correlation Application and Interpretation
RSCH FPX 7864 Assessment 2 Correlation Application and Interpretation
Name
Capella university
RSCH-FPX 7864 Quantitative Design and Analysis
Prof. Name
Date
Correlation Application and Interpretation
The study’s dependent variables include students’ final grades, grade point averages (GPAs), first quiz scores, and total grades. Additionally, data related to student demographics, standardized academic performance, and instructors’ use of formative assessments across three units are considered. The primary objective of this research is to analyze the relationship between students’ final grades and their overall GPAs. Both the cumulative mark and final grade are continuous variables, meaning they can take any value within a range (Sayyed et al., 2023). While Quiz 1 scores remain fixed, students’ gender identities are hypothetical variables. The correlational analysis involved a sample size of 105 participants, with a significance level set at 0.05.
Correlation Analysis
A correlation analysis was conducted to examine the relationships between academic performance indicators. The research focuses on two primary questions: (1) whether a student’s final grade reflects their cumulative grade, and (2) whether students’ GPAs significantly correlate with their performance on Quiz 1. The hypotheses were structured as follows:
- Null Hypothesis (H₀): There is no linear correlation between the final grade and the cumulative grade.
- Alternative Hypothesis (Hₐ): A positive correlation exists between the final grade and cumulative grade.
- Null Hypothesis (H₀): No significant relationship exists between students’ GPA and their Quiz 1 performance.
- Alternative Hypothesis (Hₐ): A significant linear relationship exists between students’ GPA and their Quiz 1 performance.
Statistical assumptions were verified through descriptive statistics, including skewness and kurtosis values. The analysis confirmed that while the distributions of the first quiz and GPA were within normal ranges, the overall grade distribution deviated slightly from normality (Verostek et al., 2021). The GPA’s skewness was -0.220, and its kurtosis was -0.688, indicating a normal distribution. The final exam results followed a similar trend, with a skewness of -0.341 and a kurtosis of -0.277. However, minor deviations in Quiz 1 and total grades suggested a slight departure from normality.
Analysis of Decision-Making Process
Understanding the distinction between categorical and continuous variables is crucial in correlation analysis. Variables such as final grades, GPA, and cumulative grades are continuous, meaning they can take any value within a defined range. In contrast, Quiz 1 scores are categorical, representing specific correct-answer counts rather than numerical values. The hypothesis framework must clearly define the expected linear relationships among variables (Thompson, 2021).
For example, two competing hypotheses regarding the relationship between total and final grades were evaluated. The null hypothesis posited that no linear correlation existed between these variables, while the alternative hypothesis suggested a direct correlation. Similarly, the relationship between Quiz 1 scores and GPA was examined under the same methodological approach. By structuring these hypotheses in a clear and testable format, the study aimed to reinforce its findings through robust statistical analysis.
Correlation Application and Interpretation
| Correlation Analysis | Research Question | Hypothesis |
|---|---|---|
| Final Grade vs. Cumulative Grade | Does a student’s final grade reflect their cumulative grade? | H₀: No linear correlation between final and cumulative grades. Hₐ: A positive correlation exists between final and cumulative grades. |
| GPA vs. Quiz 1 Score | Is there a significant correlation between GPA and Quiz 1 performance? | H₀: No significant relationship between GPA and Quiz 1 score. Hₐ: A linear relationship exists between GPA and Quiz 1 score. |
| Statistical Assumptions | Skewness Value | Kurtosis Value | Normality Assessment |
|---|---|---|---|
| GPA Distribution | -0.220 | -0.688 | Normal distribution |
| Final Test Scores | -0.341 | -0.277 | Normal distribution |
| Quiz 1 Scores | -0.5 | -1.2 | Minor negative skew; near-normal distribution |
| Total Grade | 0.8 | 2.1 | Slight positive skew and kurtosis |
Results and Interpretation
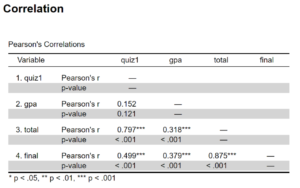
The correlation matrix analyzed four primary variables: grade point average, total GPA, Quiz 1 score, and final grade. The statistical findings revealed a strong positive correlation between total and final grades, leading to the rejection of the null hypothesis. The Pearson correlation coefficient was R = 0.88, with a p-value of 0.001, indicating a significant linear relationship between the two variables (Wu et al., 2021).
However, the relationship between GPA and Quiz 1 scores was weaker. The correlation coefficient for GPA and Quiz 1 was 0.152, with 103 degrees of freedom and a p-value of 0.112. This suggests that the association between GPA and Quiz 1 performance is not statistically significant at the 0.05 alpha level. Given the large sample size of 105 participants, the evidence does not support a strong link between GPA and Quiz 1 performance, necessitating the retention of the null hypothesis (Westrick et al., 2020). Future research with refined methodologies may be required to verify these results.
Statistical Conclusions
The findings indicated that higher final grades were positively associated with superior academic performance. However, the correlation between Quiz 1 scores and GPA was weak, failing to reach statistical significance. Given the 0.05 significance threshold, the study confirmed a direct relationship between final and total grades while leaving the GPA-Quiz 1 correlation inconclusive (Rand et al., 2020). Although a sample size of 105 participants was statistically robust, limitations such as potential biases, measurement accuracy, and confounding variables should be considered.
Application in Biostatistics
Correlation analysis is widely utilized in biostatistics to examine relationships between variables influencing biological and psychological states (Moriarity & Alloy, 2021). For instance, investigating the link between aging and cognitive decline aids in understanding neurodegenerative diseases like Alzheimer’s and dementia. By analyzing these correlations, researchers can develop early intervention strategies to enhance patient well-being (Azam et al., 2021).
Another application involves exploring the neurological basis of motor functions. Neuroimaging studies assessing brain structure and motor skills can improve the diagnosis and treatment of movement disorders (Newell, 2020). Understanding these relationships enhances patient care, facilitates early diagnosis, and enables the development of targeted interventions. Overall, correlation analysis remains a critical tool for advancing medical research and improving patient outcomes.
References
Azam, S., Haque, M. E., Balakrishnan, R., Kim, I.-S., & Choi, D.-K. (2021). The ageing brain: Molecular and cellular basis of neurodegeneration. Frontiers in Cell and Developmental Biology, 9. https://doi.org/10.3389/fcell.2021.683459
Moriarity, D. P., & Alloy, L. B. (2021). Back to basics: The importance of measurement properties in biological psychiatry. Neuroscience & Biobehavioral Reviews, 123, 72–82. https://doi.org/10.1016/j.neubiorev.2021.01.008
Rand, K. L., Shanahan, M. L., Fischer, I. C., & Fortney, S. K. (2020). Hope and optimism as predictors of academic performance and subjective well-being in college students. Learning and Individual Differences, 81, 101906. https://doi.org/10.1016/j.lindif.2020.101906
RSCH FPX 7864 Assessment 2 Correlation Application and Interpretation
Sayyed, R. A., Awwad, F. A., Itriq, M., Suleiman, D., Saqqa, S. A., & AlSayyed, A. (2023). The pass/fail grading system at Jordanian universities for online learning courses from students’ perspectives. Frontiers in Education, 8. https://doi.org/10.3389/feduc.2023.1186535
Wu, H., Guo, Y., Yang, Y., Zhao, L., & Guo, C. (2021). A meta-analysis of the longitudinal relationship between academic self-concept and academic achievement. Educational Psychology Review. https://doi.org/10.1007/s10648-021-09600-1